

Insights
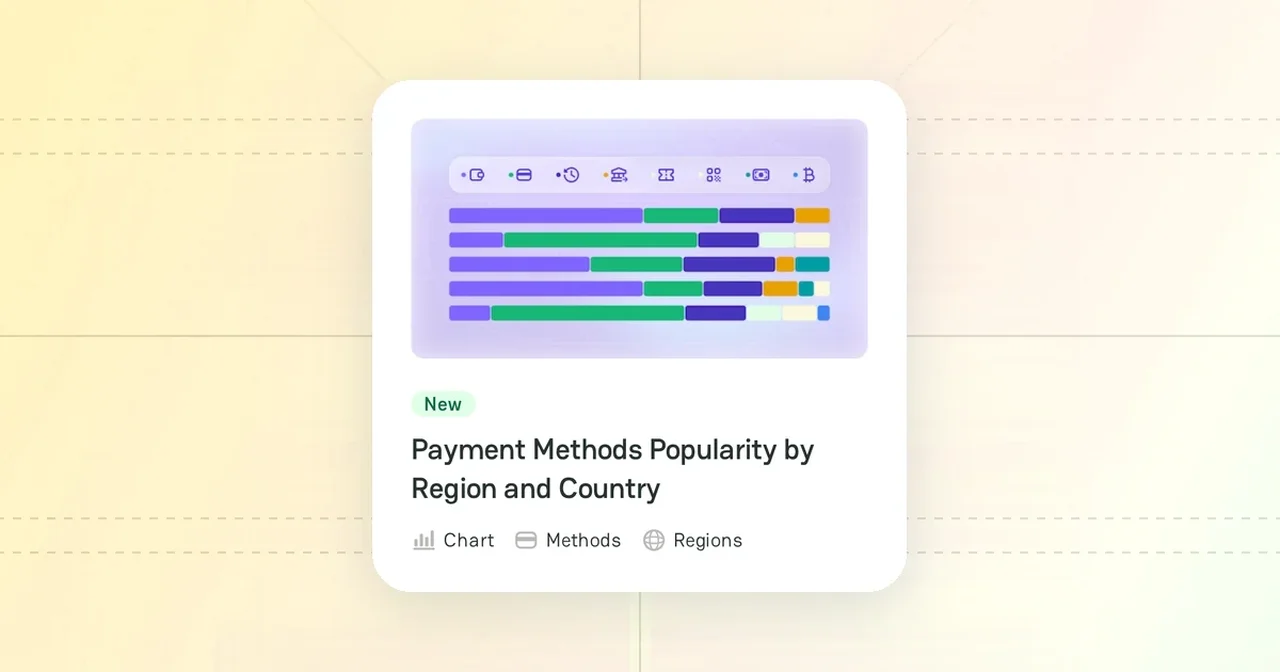
Insights are interactive maps and charts made from the PayAtlas catalog. They show where providers and payment methods are available, how the market splits across services, and how industries connect to payment methods. To open them, click Insights in the site header.
Insight groups
The Insights page puts the insights into groups:
| Group | What it shows |
|---|---|
| Global Coverage Maps | The number of providers and payment methods in each country |
| Adoption & Popularity Maps | Heat maps of provider density, payment method popularity, and the share of card payments, bank transfers, and e-wallets in each country |
| Market Breakdown Treemaps | How providers split across payment services |
| Comparative Breakdowns | The popularity of payment method categories in each region and country |
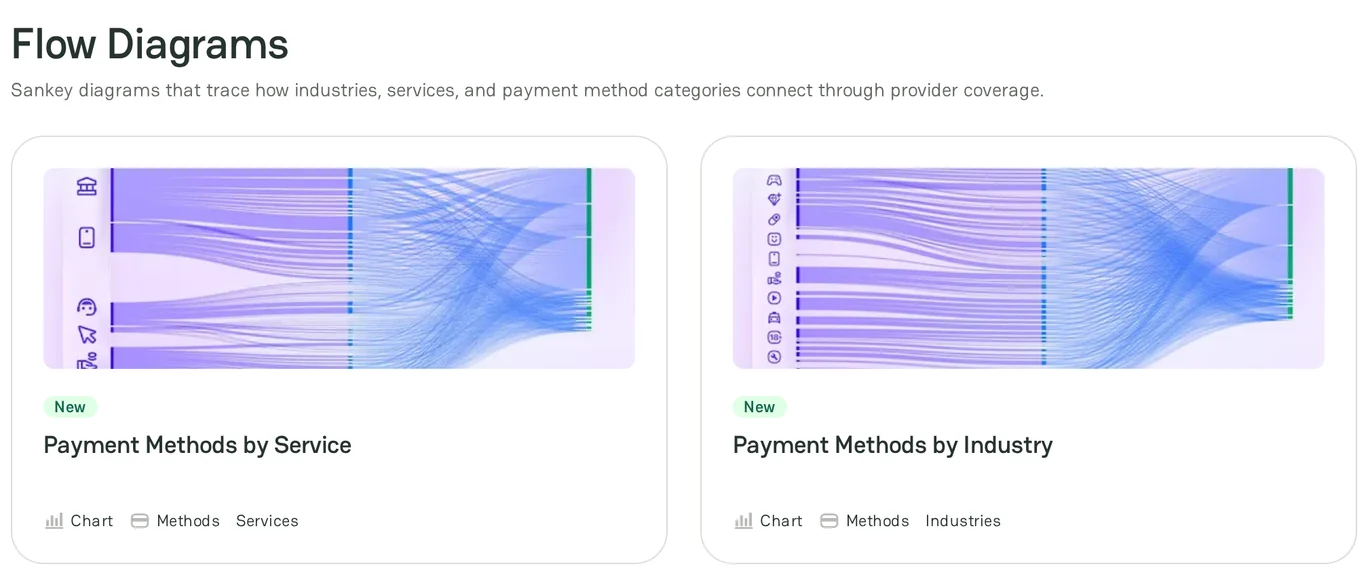
| Flow Diagrams | How industries and services connect to payment method categories |
| Taxonomy Trees | How the PayAtlas catalog is organized |
The New badge marks a recently added insight.
Maps
The coverage maps and the heat maps work in the same way:
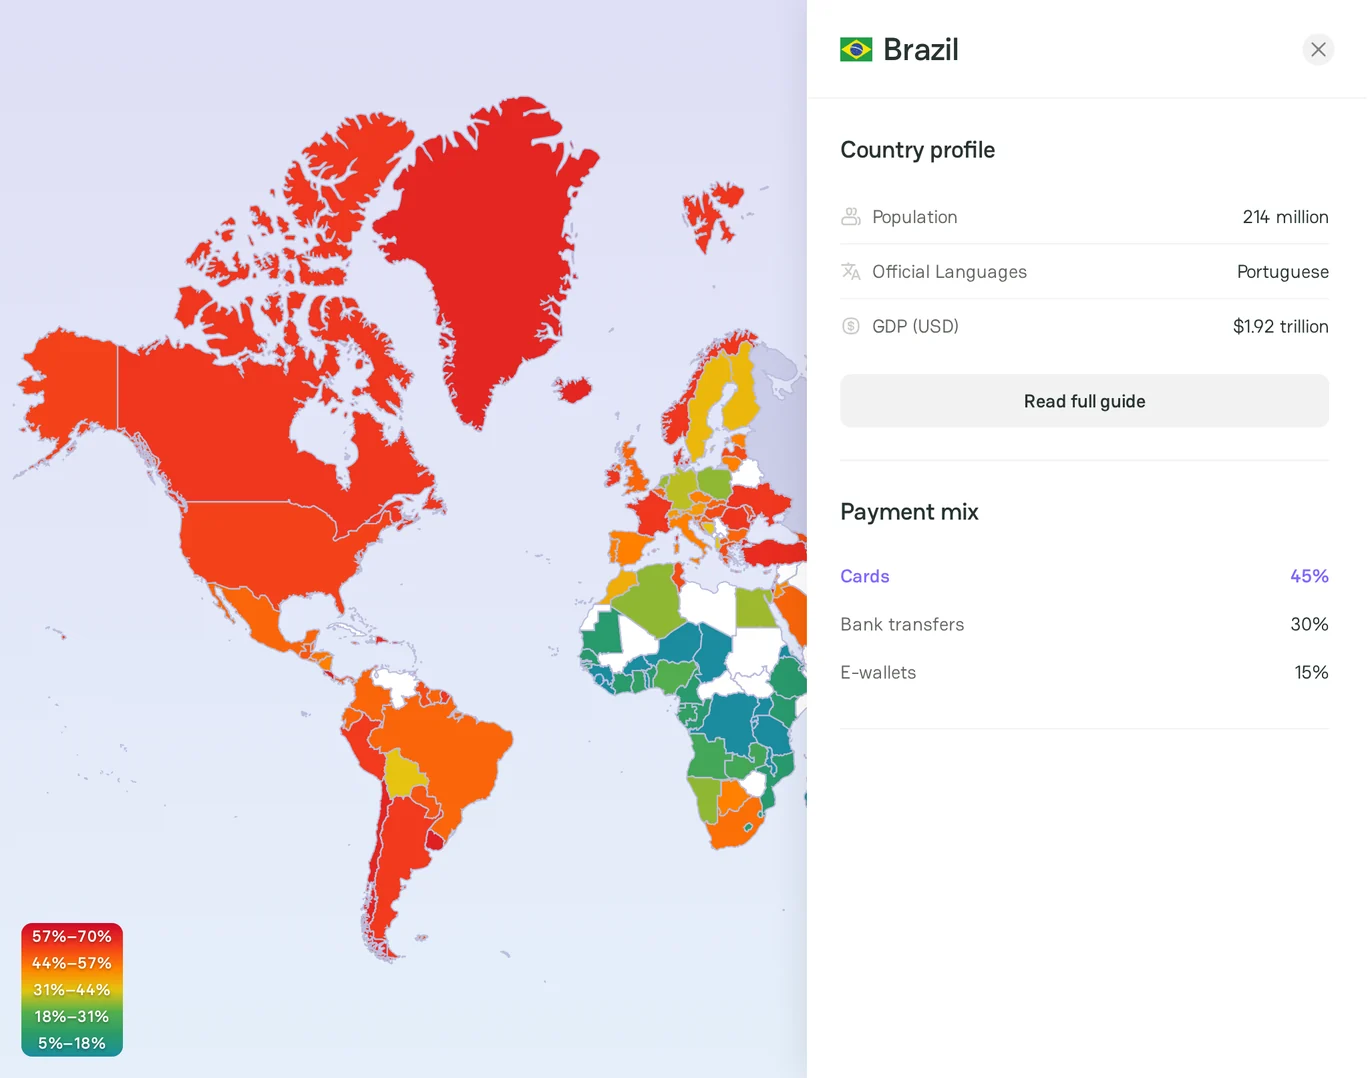
- Point to a country to see its value, for example its number of providers or its share of card payments. On a heat map, the legend in the bottom left corner shows the value of each color.
- Click a country to open its panel. The panel shows the country profile and, depending on the map, the payment mix or the providers and payment methods of the country. Click Read full guide to open the country guide.
- Use Zoom In and Zoom Out to change the scale of the map.
- Click Download Map (PNG) to save the map as an image.
Charts
Read the comparative breakdown
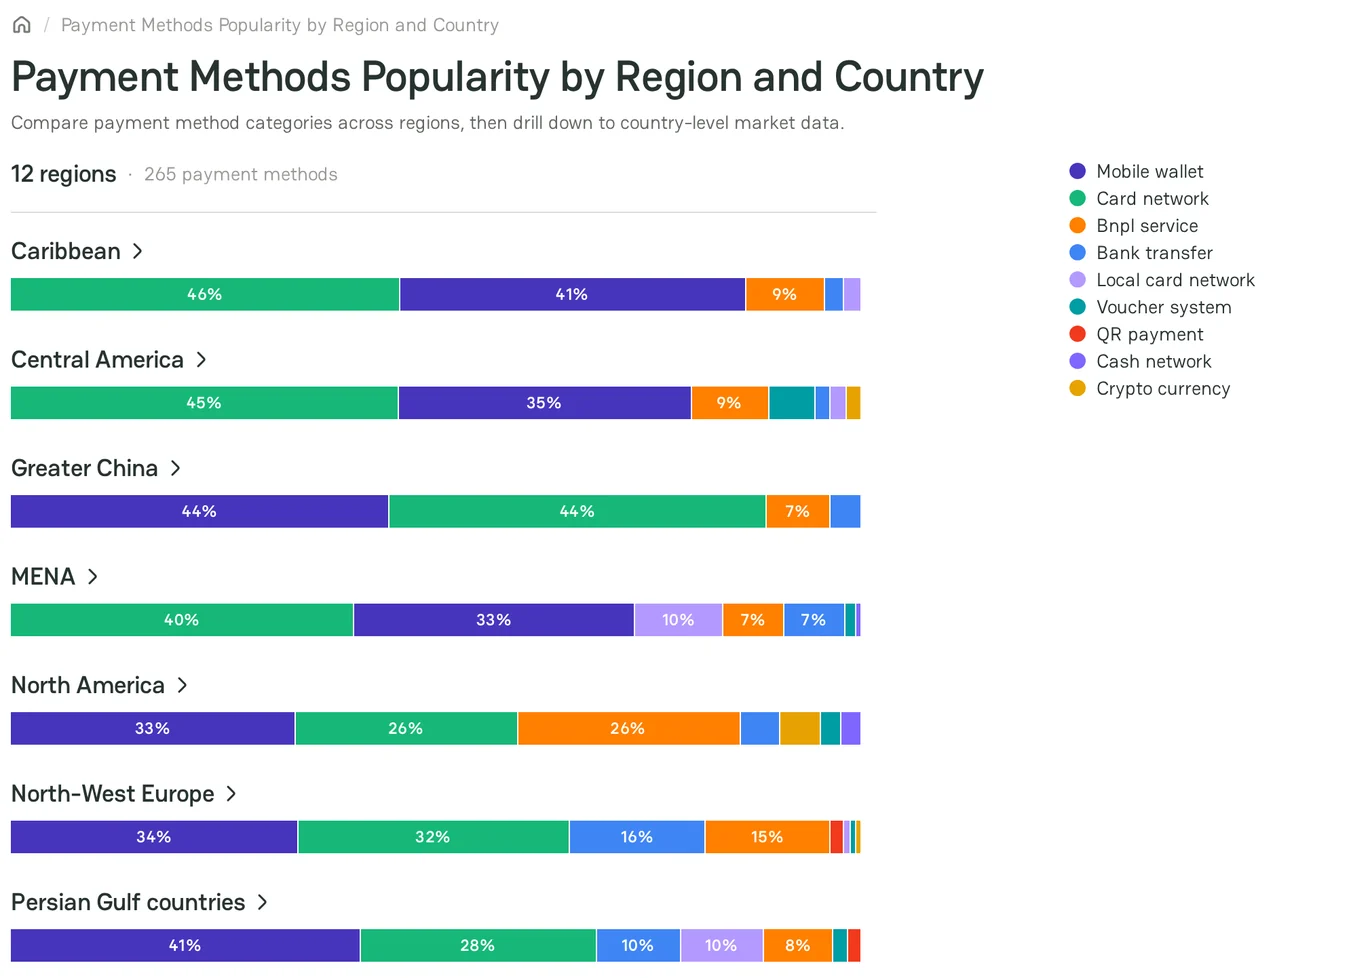
The chart shows one bar for each region. Each bar shows the share of each payment method category. The legend shows the color of each category.
- Point to a part of a bar to see the share and the top payment methods of the category.
- Click a region to see its countries.
- If a country has a guide, click the country name to open the guide.
- To go back to the regions, click the chart title.
Read the treemap
Each tile is a payment service. The size of a tile shows the number of providers that offer the service. Click a tile to open Atlas with this service filtered.
Read the flow diagrams
A flow diagram connects three columns, for example industry sectors, industries, and payment method categories. Point to a band to see the number of providers and payment methods that link two items.
Read the taxonomy tree
The tree shows the categories of the PayAtlas catalog: payment methods, services, industries, geography, and currencies.
- Click a branch to expand or collapse it.
- Select Tidy tree or Cluster to change the layout.
- Click a domain in the legend to show or hide it.
Insight page
Under the chart, each insight page has these parts:
- About this Insight: what the insight shows and how PayAtlas makes it.
- Insight FAQ: answers to frequent questions about the insight.
Some insight pages also have Linked items: the related guides and pages, such as the regions or the payment method categories of the chart.
Related articles
- To read the guides behind the data, see Knowledge hubs.
- To find a provider for a service, see Find a provider in Atlas.



Comments